May 12, 2025
Monthly Investment Commentary: May 2025

For the last several years, owning U.S. large-cap stocks was the easiest strategy to drive outsized returns. U.S. multinational firms earned more than what would have been possible if they had been restricted to U.S. economic growth alone. Instead, they gained market share globally, pushing the percent of revenues sourced outside the U.S. for the S&P 500 Index constituents to nearly 40%1.
Alas, the world is changing. Trade tensions and shifting geopolitical dynamics are raising questions about the future. The result is that policymakers and investors are increasingly looking beyond where a company is domiciled. Where a company sources its revenue is becoming a key differentiator—particularly its sensitivity to trade with the U.S.
Rethinking International Diversification
In a recent webinar, we talked about the importance of knowing not just what a company does but where it does it. For example, a company that is headquartered in the U.S. might still rely heavily on overseas customers and supply chains.
Historically, global reach was a strength. U.S. companies that sold abroad were able to expand their markets, which proved rewarding to shareholders. More recently, managing a global footprint is inviting additional political risk.
This year, for example2:
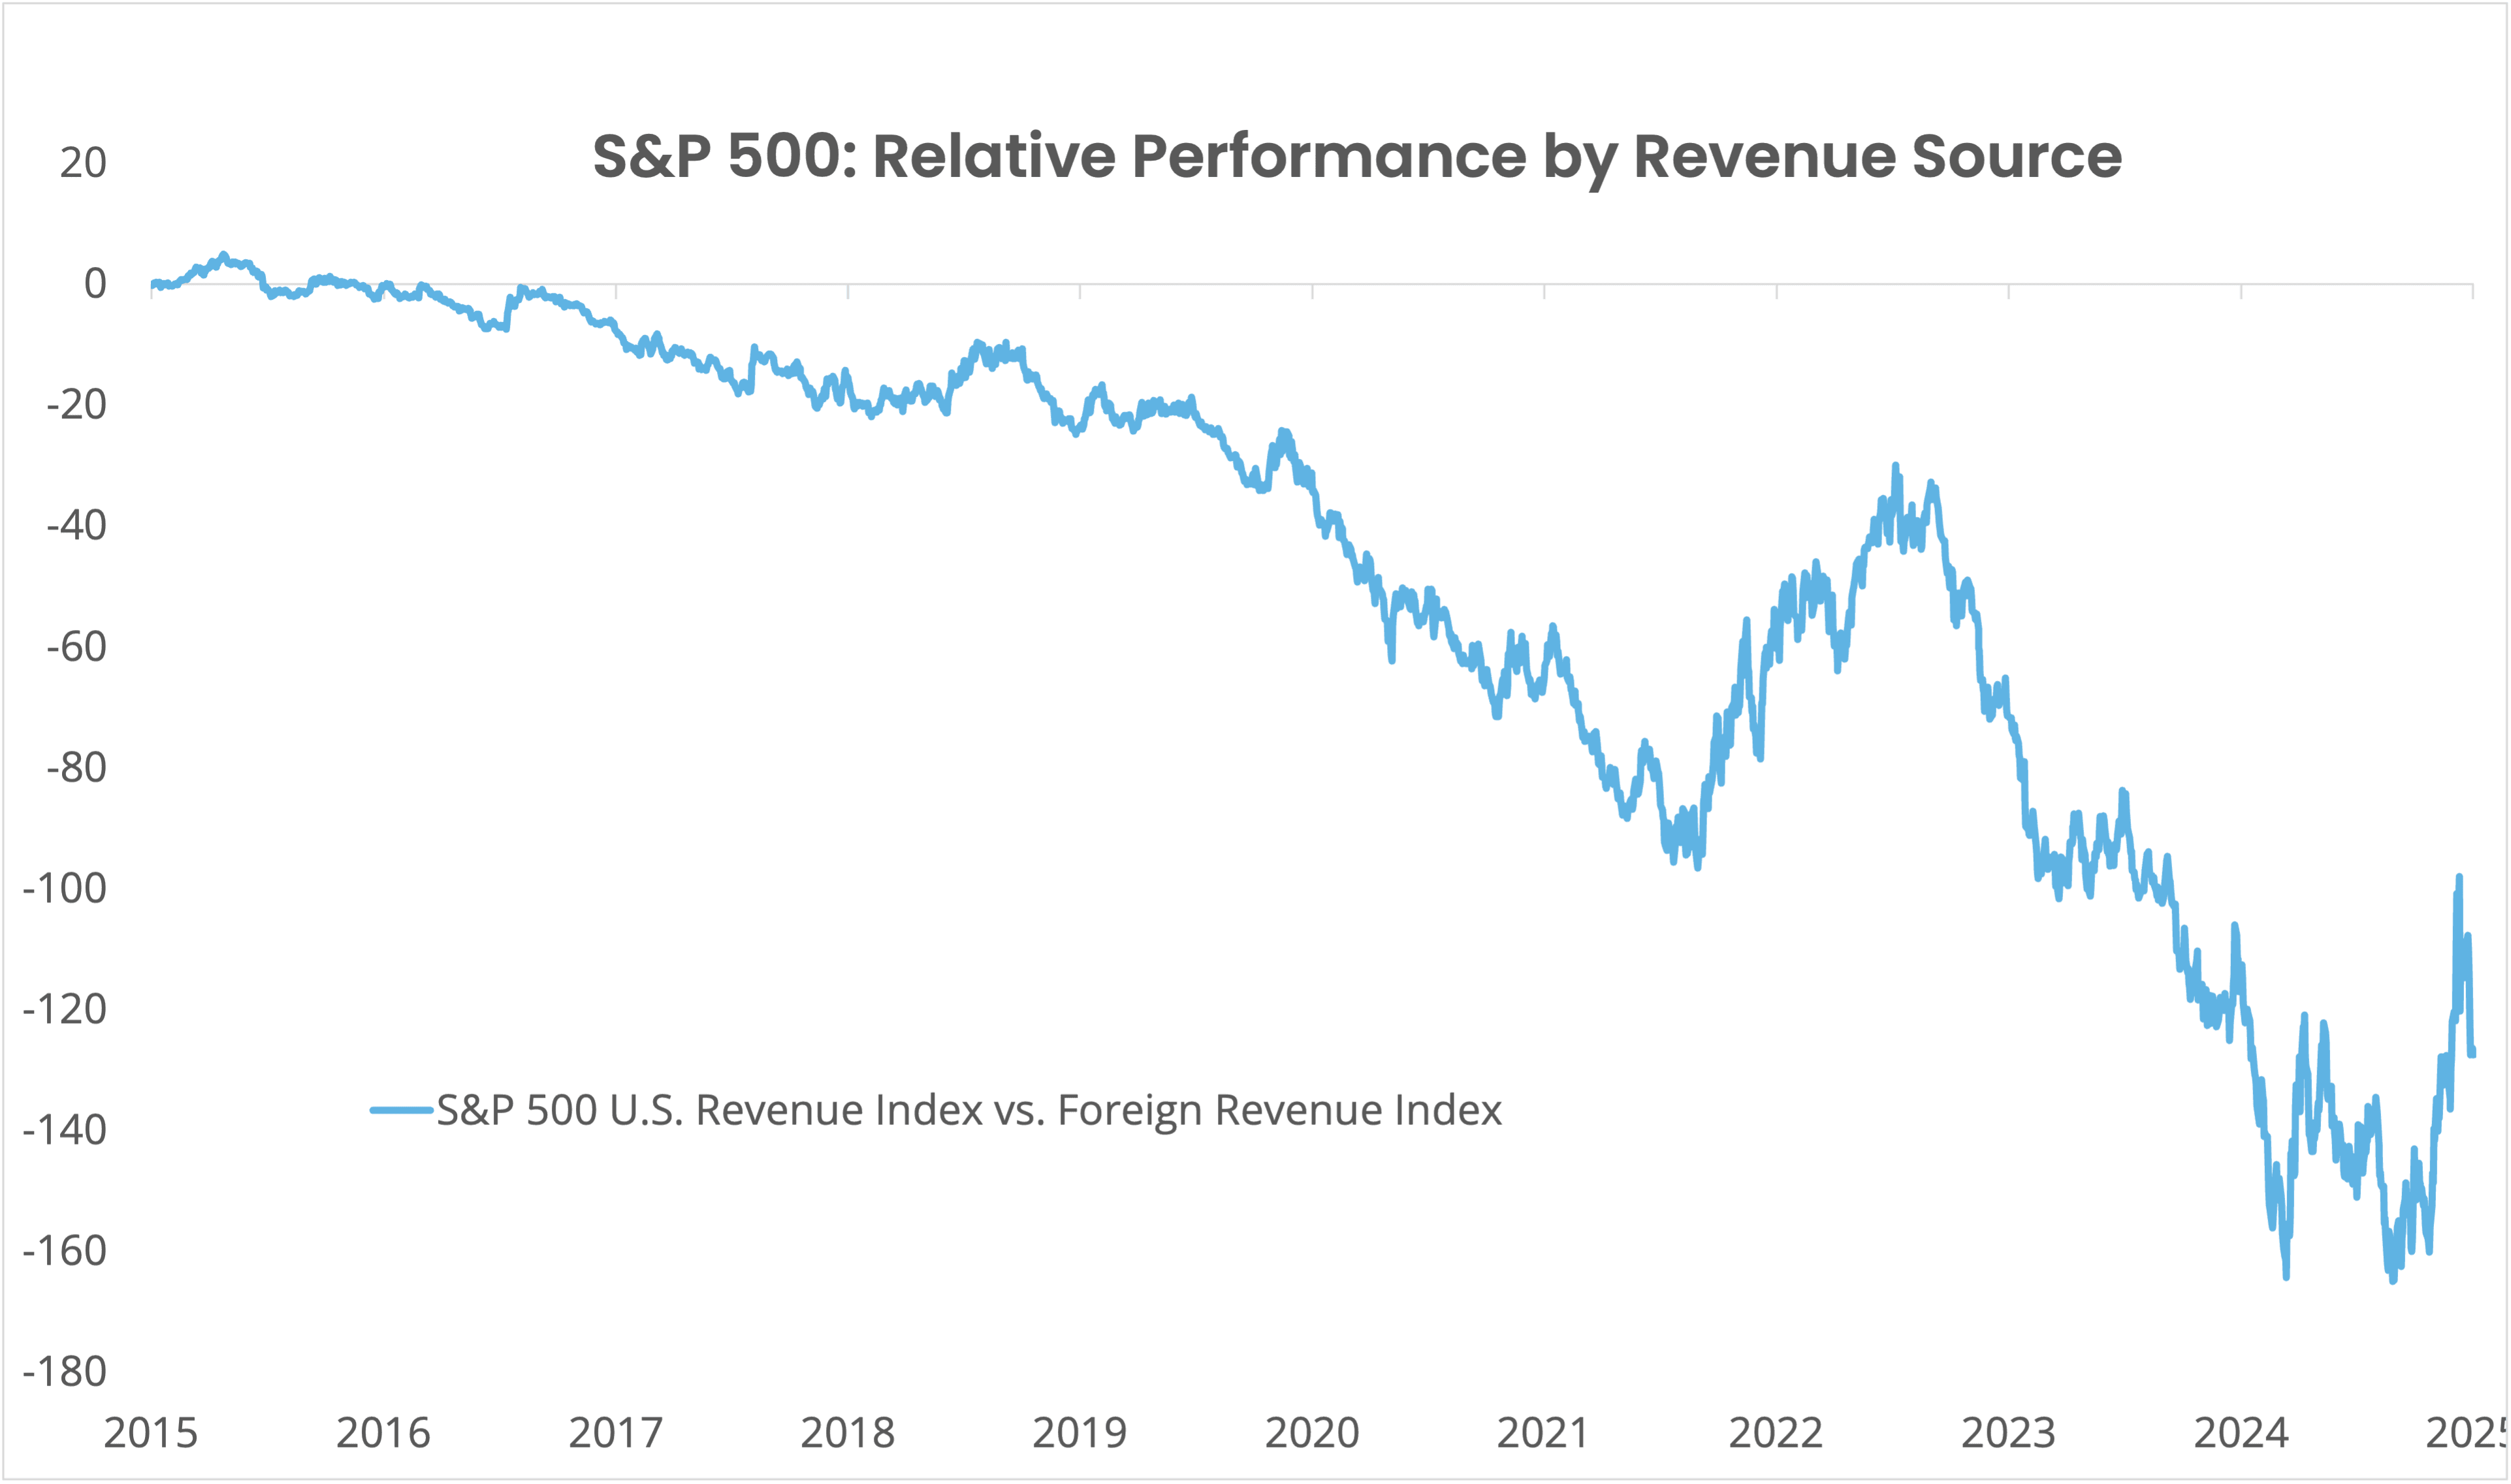
Source: S&P Dow Jones Indices LLC. Please see disclosures for methodology used.
- Companies in the S&P 500 that rely heavily on foreign revenue are down 6.9%.
- Companies with mostly domestic revenue, on the other hand, are down just 0.2%.
- International domiciled companies, however, are the real winners, rising 11.8% this year through April.
For years, the saying went “when the U.S. sneezes, the rest of the world catches a cold.” So far this year, U.S. equities appear under the weather while international stocks are thriving.
Where a Company Makes Its Money Matters
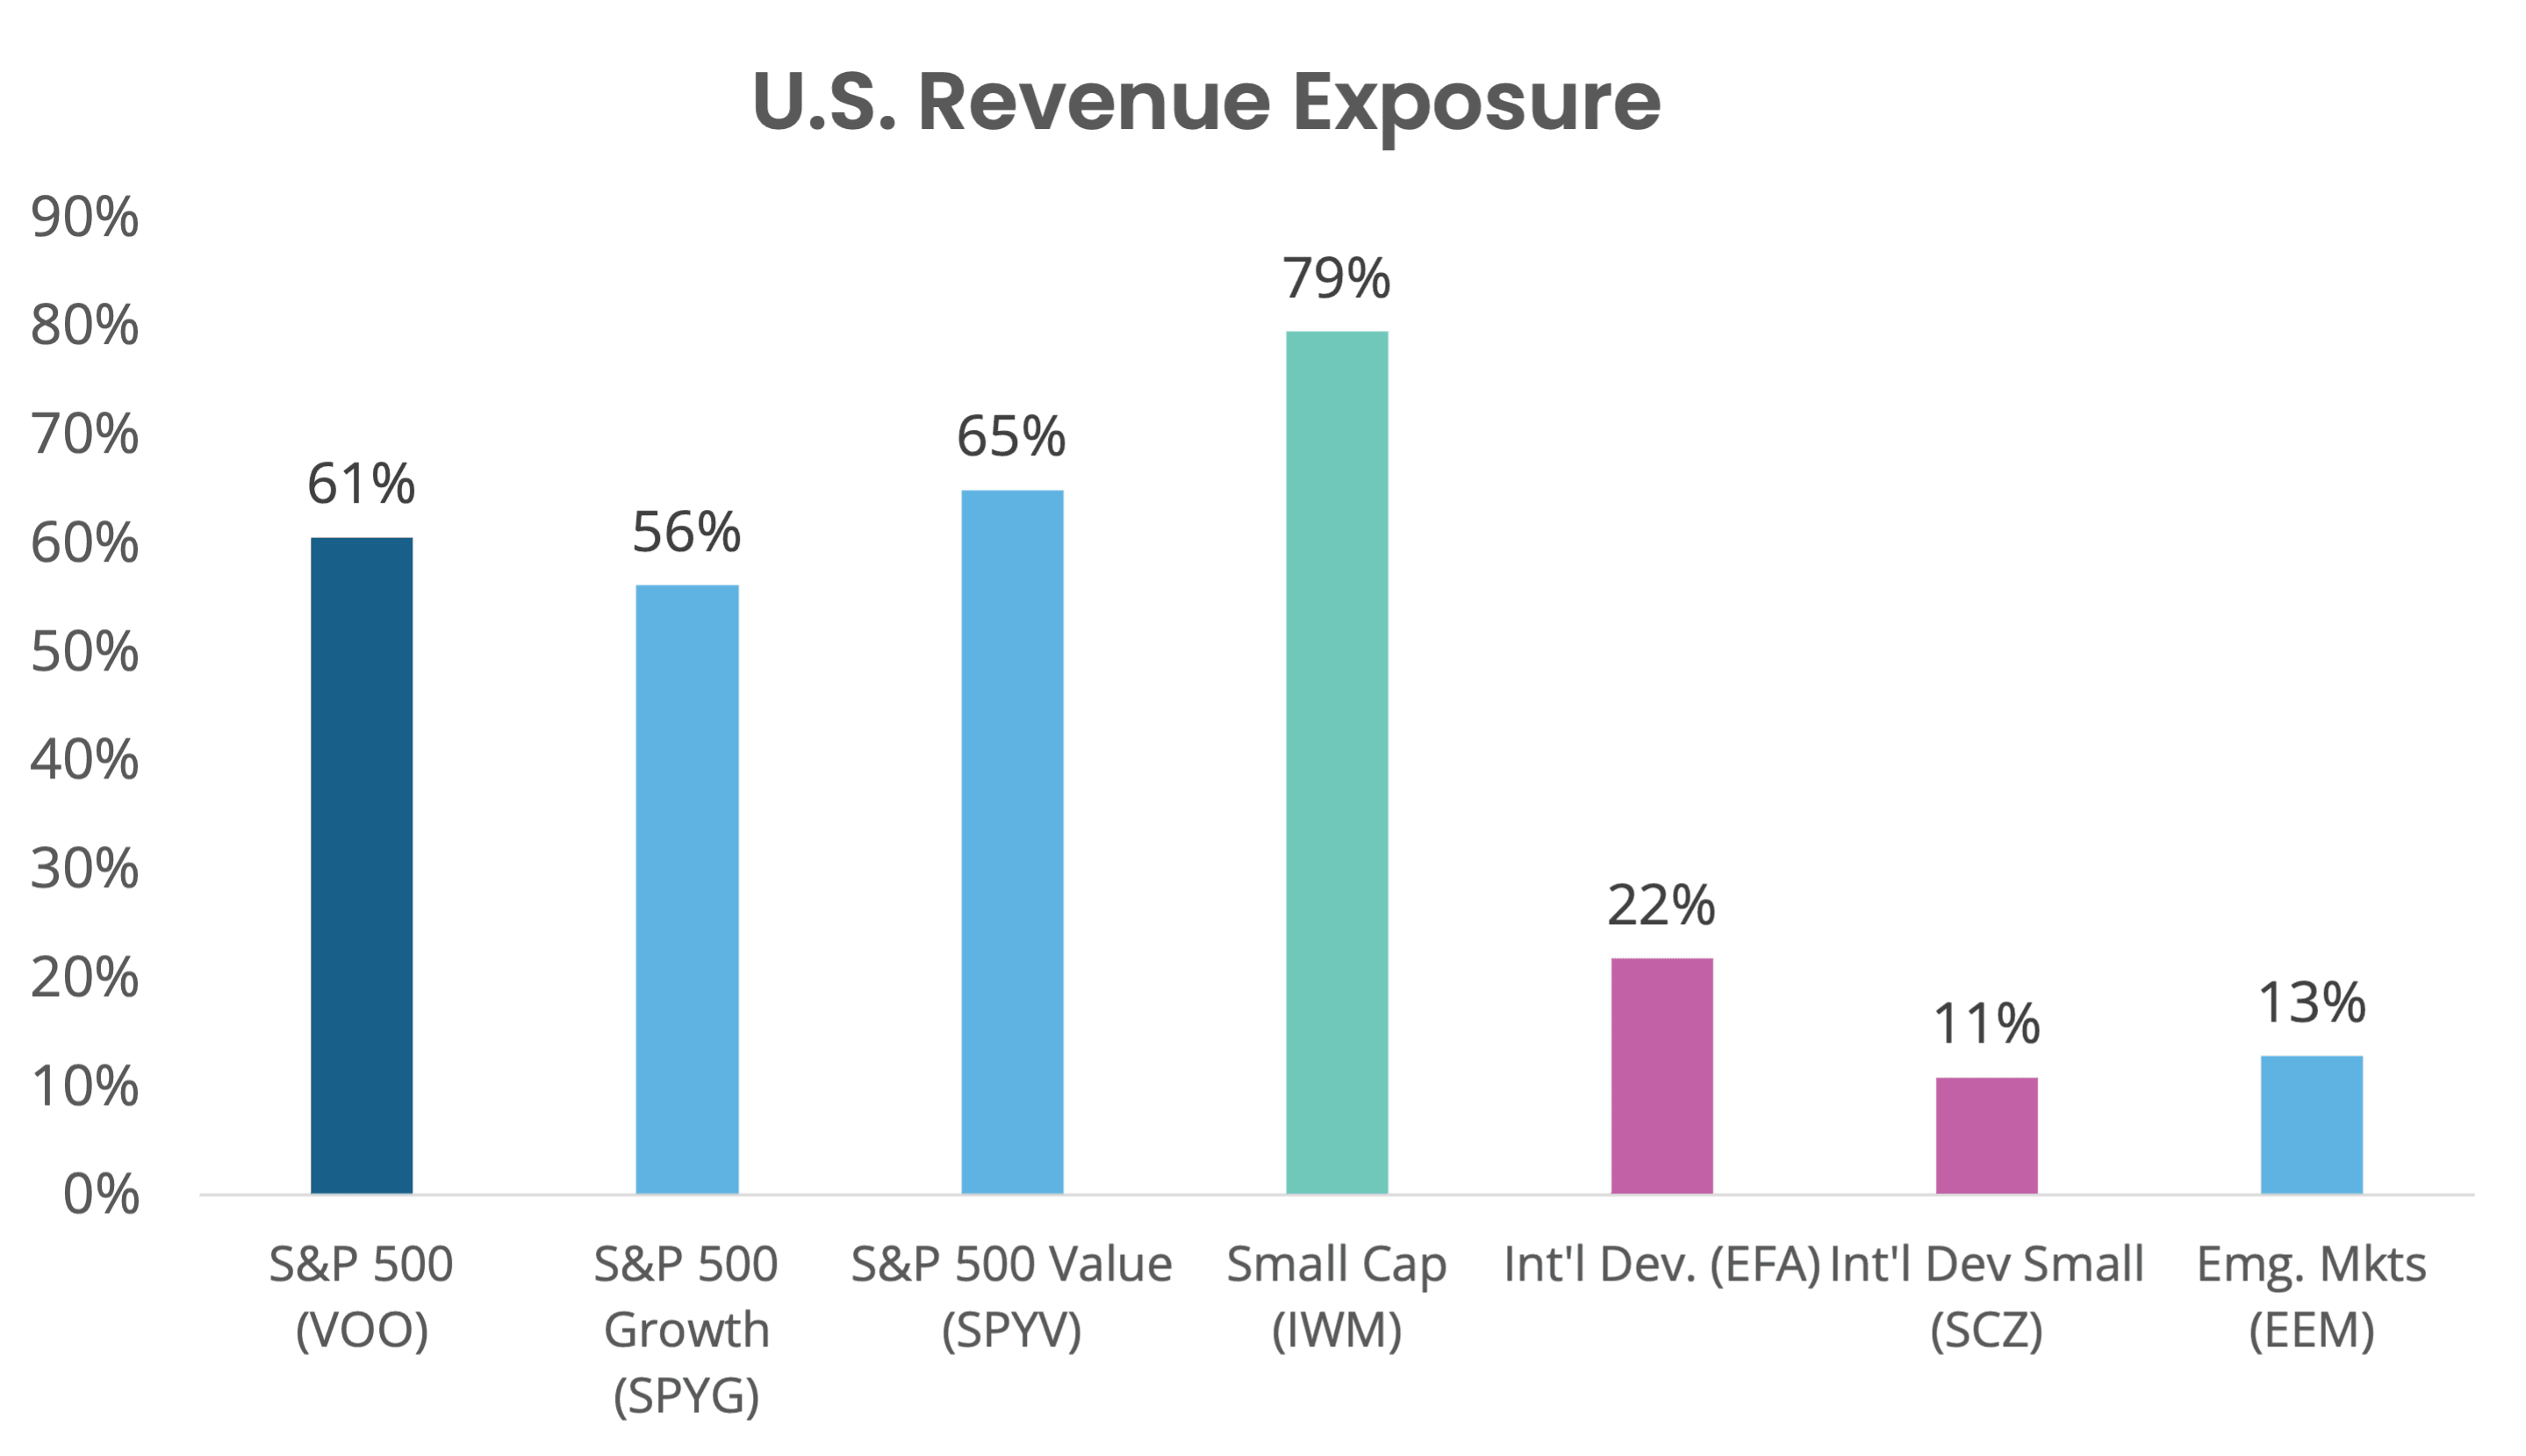
The chart represents U.S. revenue exposure by asset class as of March 31, 2025.
The revenue exposure of different indices3 can look different depending on the type of companies that make up the index:
- Large U.S. growth companies (like technology) often have more foreign revenue.
- Value stocks (like banks and utilities) typically have less.
- Small-cap stocks tend to be more local, with only about 20% of their revenues coming from outside the U.S.
Meanwhile, international companies are less dependent on U.S. buyers, particularly emerging markets and small-cap foreign companies. On average, they generate only 11% to 13% of their revenue from the U.S.4
But What About the Trade Deficit?
If U.S. companies earn more from abroad than foreign companies, why does the U.S. still run a trade deficit?
The answer lies in the difference between where things are sold versus where they are made. Many of the U.S. companies that generate revenue globally rely on imports to build their products. In other words, the goods they sell to foreign customers are often manufactured or serviced from overseas.
Take China, for example. While the U.S. trade deficit with China is nearly $300 billion, analysts estimate that S&P 500 companies derive more than $1.1 trillion from the country. This is made up from companies like McDonalds (6,820 restaurants in China), Walmart (364 stores in China), and Apple (sold 43 million iPhones in China in 2024).5
In trade terms, the U.S. might appear to be losing; however, from a profits perspective, U.S. companies have been winning, delivering strong earnings and revenue growth for shareholders.
What Should Investors Do?
If we’re entering a period of more tariffs, geopolitically driven changes to supply chains, and “buy local” nationalist policies, investors may want to consider strategies that emphasize:
- International companies that produce and sell within their home markets
- U.S. businesses with less dependence on global trade
We call this the “made at home” strategy. Importantly, this isn’t just a U.S. trend. Around the world, consumers and policymakers are rethinking globalization. If the benefits that they’ve enjoyed begin to erode, they may also pivot toward supporting local businesses.
As always, we’re here to help you think through your portfolio strategy in this evolving landscape, and to make sure your investments are aligned with the opportunities and challenges ahead.
Click here to view the May Monthly Investment Commentary.
Sources:
1. Morningstar
2. Standard & Poors, MSCI
3. Morningstar
4. Morningstar
5. Apollo ((https://www.apolloacademy.com/...)
S&P 500: Relative Performance by Revenue Source: The launch date of the S&P 500 Foreign Revenue Exposure Index was August 31, 2017. The launch date of the S&P 500 U.S. Revenue Exposure Index was January 9, 2017. Index values provided for any date or time period prior to the index’s Launch Date are considered hypothetical back-tested performance, not actual performance. The hypothetical performance is based on the index methodology in effect on the launch date. However, when creating back-tested history for periods of market anomalies or other periods that do not reflect the general current market environment, index methodology rules may be relaxed to capture a large enough universe of securities to simulate the target market the index is designed to measure or strategy the index is designed to capture. Back-tested performance reflects application of an index methodology and selection of index constituents with the benefit of hindsight and knowledge of factors that may have positively affected its performance, cannot account for all financial risk that may affect results and may be considered to reflect bias.
The information provided is educational and general in nature and is not intended to be, nor should it be construed as, specific investment, tax, or legal advice. Individuals should seek advice from their wealth advisor or other advisors before undertaking actions in response to the matters discussed. No client or prospective should assume the above information serves as the receipt of, or substitute for, personalized individual advice. This should not be considered a recommendation that any particular security, portfolio of securities, transactions, or investment strategy are suitable for any specific person.
This reflects the opinions of Focus Partners or its representatives, may contain forward-looking statements, and presents information that may change. Nothing contained in this communication may be relied upon as a guarantee, promise, assurance, or representation as to the future. Past performance does not guarantee future results. Market conditions can vary widely over time, and certain market and economic events having a positive impact on performance may not repeat themselves. The charts and accompanying analysis are provided for illustrative purposes only. Investing involves risk, including, but not limited to, loss of principal. Focus Partners' opinions may change over time due to market conditions and other factors. Numerous representatives of Focus Partners may provide investment philosophies, strategies, or market opinions that vary. The appropriateness of a particular investment or strategy will depend on an investor's individual circumstances and objectives. Because of the many variables involved, an investor should not rely on this forecast alone.
Any index or benchmark shown or discussed is for comparative purposes to establish current market conditions. Index returns are unmanaged and do not reflect the deduction of any fees or expenses and assumes the reinvestment of dividends and other income. You cannot invest directly in an index. This is prepared using third party sources considered to be reliable; however, accuracy or completeness cannot be guaranteed. The information provided will not be updated any time after the date of publication.
Services are offered through Focus Partners Wealth, LLC (“Focus Partners”), an SEC registered investment adviser with offices throughout the country. Please be advised that Focus Partners only shares video and content through our website or other official sources. Services and investment advice are only provided pursuant to an advisory agreement with the client. Focus Partners' Form ADV Part 2A and 2B and Privacy Statement will be provided as required by law and include a description of fees payable for investment advisory services. ©2025 Focus Partners Wealth, LLC. All rights reserved. RO-25-4482371
Category
InvestingContent Topics
About the Author

Jason Blackwell
Chief Investment Strategist

